For Operations Leaders who are tired of defending OEE numbers the CFO can't find in EBITDA:
Stop improving OEE in the wrong place. Start moving EBITDA from the right one.
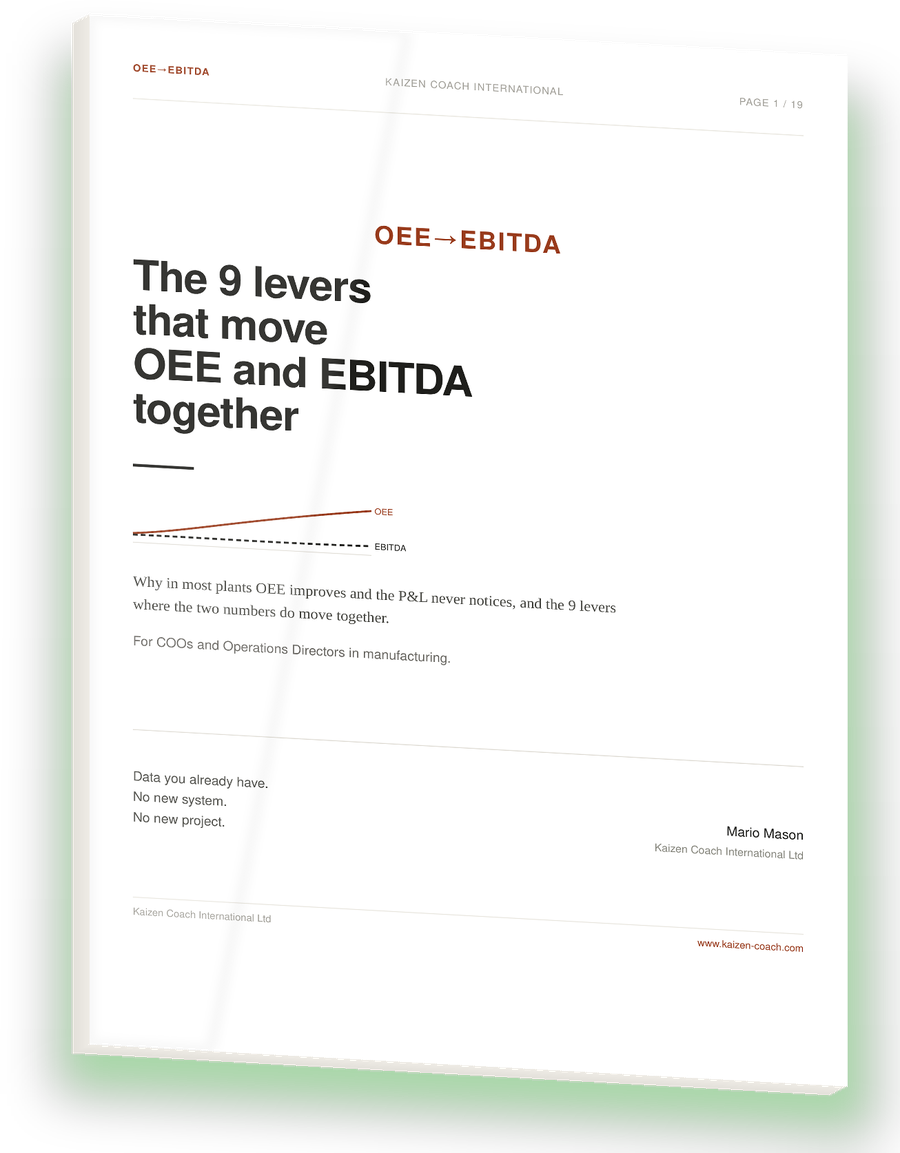
This Free 19-page PDF Guide teaches the 9-Lever Method, a precise approach that identifies which line to attack first, which levers to pull, and how to use them to grow OEE and make sure the gains stay in the P&L instead of vanishing within 90 days.
You already know what lean is supposed to do.
You’ve run the workshops. You’ve built the dashboards. You’ve sat in the reviews where the OEE slide goes up and the CFO says nothing, or worse, asks the question nobody wants to answer: “The number improved. Where did the money go?”
That question doesn’t go away. It just gets more expensive.
Here’s the problem nobody puts in the meeting minutes: OEE and EBITDA are not automatically connected. They connect only through precise choices, where you raise OEE, which loss you attack first, what you do with the capacity you free up. Make the wrong choices and OEE climbs while working capital stays trapped, overtime stays normalized, and margin stays exactly where it was.
It’s not a measurement problem. It’s not an effort problem. It’s a connection problem.
And it’s fixable. Not with a new system. Not with a new project. With the data you already have, applied through 9 levers in the right sequence, at the right point in your operation.
That’s what this guide gives you.
- 1The Financial Bottleneck Grid (Lever 0)The 3-variable grid that crosses OEE by line, role in the flow, and hourly economic value to tell you in 30 minutes which line in your plant carries the greatest financial weight. Because a workshop on the wrong line cannot, by definition, reach the P&L.
- 2The 3-Step Workshop AuditThe sequence that maps where your improvement energy went over the last quarter, compares it against the 16 TPM losses, and tells you in euros, not percentages, which dominant loss you are paying for every month without knowing it.
- 3The 9 Levers, the Work Plan for Every Underperforming LineOnce Lever 0 has identified which line to attack, the 9 Levers guide you through every loss dimension on that line: changeovers, breakdowns, micro-stops, quality, logistics, labour, planning, energy, and sustainability. The result is not an analysis. It is a precise, prioritised, scheduled work plan that says exactly what to do, in what order, and with what expected impact on the P&L and the balance sheet.
- 4The Daily Meeting Blueprint, Lever 8The model that redesigns the shop-floor daily meeting around three columns: yesterday's OEE deviation → cost in euros → decision with an owner and a date. No storytelling, no "we are monitoring it". Because a deviation priced in euros generates a decision. A deviation in percentage generates an explanation. And only decisions reach the P&L. The trap is the meeting your department is probably already running: punctual, tidy, and financially empty.
- 5The Strategic Document for the CFOA one-page guide that translates every lever into the language your CFO uses: the exact P&L and balance-sheet lines that move, formatted to survive a financial review, not to look convincing in an operations presentation.
- 6The Sustainability Grid, 90-Day CheckpointThe grid that measures, workshop by workshop on your bottleneck line, how much OEE you gained, how much you kept, and how much you gave back. Because in many plants, when you add up that column, the cost of backsliding exceeds the budget of every new project under consideration.
WHY ACT NOW
Every week that your plant's financial bottleneck stays unidentified is a week of workshops, meetings, and improvement actions spent in the wrong place.
This is not a future problem. It is already on your P&L. Every day.
The cost of delay is not abstract. It is normalised overtime. It is premium freight justified as "necessary". It is scrap and rework discussed as technical problems instead of margin losses. It is inventory quietly growing while working capital shrinks. It is the gap between what your workshops produce operationally and what the CFO finds, or does not find, in EBITDA.
Lever 0 takes 30 minutes with last month's real data. That first step tells you exactly where you stand, and where the method needs to take you. From there, the journey can take weeks. But every week you do not start is a week in which the gap between operational activity and financial impact keeps costing you.
The question is not whether you have time to do it. The question is: how much is not doing it costing you, every week?
This method does not ask you to start over. It teaches you to look differently at what you are already doing and to apply the method that actually moves money. Ten minutes with last month's data and the Lever 0 grid will show you exactly where and how to focus your improvement effort.
It is a different kind of strategic and operational clarity from what your dashboard can give you.
Send me:
The 9-Lever Method
That Improves OEE and EBITDA
19 pages · Free · Immediate Download
WHO I AM

My name is Mario Mason.
I am not a Lean academic. I did not build this method in a classroom or in university research. I built it inside plants, alongside production teams, plant managers, Operations Directors and COOs who carry real responsibility for results.
I have worked with Henkel, Electrolux, Ferrero, Sanofi, Mondelez, Rio Tinto, Aprilia, De Longhi, Dainese, Kraft, Roquette, Valsir, Raffmetal, Fondital, Climaveneta, McBride, Metalcolor, Henri Hutin, Breton, Molteni, Euroapi, Delifrance, Cristal Saint-Louis and SDF. Across Europe, the Middle East, Africa, the Americas and Asia. Not as the consultant who runs a workshop and disappears with the slides. As the coach who works alongside the people who actually control daily behaviours, because they are the ones who decide whether improvement stays or fades.
I have seen the same pattern repeat too many times. Capable operations directors. Real improvement work. Sincere commitment. And results that did not stay in the P&L. Not because the leaders were wrong. Not because the teams resisted. But because nobody had ever built the explicit link between the decision taken on the shop floor this morning and the P&L line that moves this week.
The 9-Lever Method was born from that observation. It is simple in principle and demanding in practice. And the only result I care about is the one that remains after I am gone.